Dashboard
Map Data
Toggle navigation
Children
& Youth
CHILDREN AND YOUTH INDICATORS
Children Living in Poverty
Children Living in Poverty, by Race/Ethnicity
Single-Parent Families
Single-Parent Families, by Race/Ethnicity
Rate of Child Abuse and Neglect
Rate of Foster Care Admissions
Teen Pregnancy
Key Trends
All Indicators
Maps
Community
COMMUNITY INDICATORS
Voter Registration Rate
Voter Participation Rate
Violent Crimes
Domestic Violence
Arrest Rates, by Race/Ethnicity
Incarceration Rates, by Race/Ethnicity
Key Trends
All Indicators
Maps
Demographics
DEMOGRAPHICS INDICATORS
Total Population
Population by Age
Population by Race/Ethnicity
Household Types
Foreign-Born Population
Key Trends
All Indicators
Maps
Economy
ECONOMY INDICATORS
Change in Total Jobs
Change in Jobs by Sector
Spending for County Government
Tourism Revenue
Key Trends
All Indicators
Maps
Education
EDUCATION INDICATORS
Preschoolers Receiving Special Education Services
Prekindergarten Participation
Students Receiving Special Education Services
Per-Student Spending
Student Performance on Grade 4 English, by Student Group
Student Performance on Grade 4 English, by Race/Ethnicity
Student Performance on Grade 4 Math, by Student Group
Student Performance on Grade 4 Math, by Race/Ethnicity
High School Cohort Graduation Rate
High School Cohort Dropout Rate
High School GED Rate
Education Levels of Adults
Education Levels of Adults, by Race/Ethnicity
Key Trends
All Indicators
Maps
Financial
Stability
FINANCIAL STABILITY INDICATORS
Median Household Income
Median Household Income, by Race/Ethnicity
People Living in Poverty
People Living in Poverty, by Race/Ethnicity
Seniors Living in Poverty
Veterans Living in Poverty
Children Receiving Subsidized Child Care
Economically Disadvantaged Students
Earned Income Tax Credit Participation
Living Wage Rate by Household Type
Income in Relation to Poverty Level
Households Receiving SNAP
Food Insecurity
Key Trends
All Indicators
Maps
Health
HEALTH INDICATORS
People Without Health Insurance
Early Prenatal Care, by Mother's Race/Ethnicity
Deaths from Drug Overdoses
Babies with Low Birth Weights
Newly Diagnosed Cases of HIV
People Living wth HIV
Mental Health Clinic Visits
Key Trends
All Indicators
Maps
Housing
HOUSING INDICATORS
Homeownership Rates
Homeownership Rates, by Race/Ethnicity
Cost of Homeownership
Cost of Rent
Cost of Rent, by Race/Ethnicity
Homeless Persons
Key Trends
All Indicators
Maps
Racial Equity
RACIAL EQUITY INDICATORS
Children Living in Poverty, by Race/Ethnicity
Single-Parent Families, by Race/Ethnicity
Population by Race/Ethnicity
Student Performance on Grade 4 English, by Race/Ethnicity
Student Performance on Grade 4 Math, by Race/Ethnicity
Education Levels of Adults, by Race/Ethnicity
Median Household Income, by Race/Ethnicity
People Living in Poverty, by Race/Ethnicity
Early Prenatal Care, by Mother's Race/Ethnicity
Homeownership Rates, by Race/Ethnicity
Cost of Rent, by Race/Ethnicity
Arrest Rates, by Race/Ethnicity
Incarceration Rates, by Race/Ethnicity
Key Trends
All Indicators
Maps
All Indicators
Dashboard
Map Data
Viewpoints
Regional Overview
[{"name":"Children Living in Poverty","data_endpoint":"children-living-in-poverty","has_map":1,"id":"2010","show_on_dashboard":1,"show_on_homepage":1,"subtopic":null,"parent_url":"children_youth","parent_name":"Children and Youth"},{"name":"Children Living in Poverty, by Race\/Ethnicity","data_endpoint":"children-living-in-poverty-by-race-ethnicity","has_map":0,"id":"2011","show_on_dashboard":1,"show_on_homepage":0,"subtopic":null,"parent_url":"children_youth","parent_name":"Children and Youth"},{"name":"Single-Parent Families","data_endpoint":"single-parent-families","has_map":1,"id":"2020","show_on_dashboard":1,"show_on_homepage":0,"subtopic":null,"parent_url":"children_youth","parent_name":"Children and Youth"},{"name":"Single-Parent Families, by Race\/Ethnicity","data_endpoint":"single-parent-families-by-race-ethnicity","has_map":0,"id":"2021","show_on_dashboard":1,"show_on_homepage":0,"subtopic":null,"parent_url":"children_youth","parent_name":"Children and Youth"},{"name":"Rate of Child Abuse and Neglect","data_endpoint":"rate-of-child-abuse-and-neglect","has_map":0,"id":"2013","show_on_dashboard":1,"show_on_homepage":0,"subtopic":null,"parent_url":"children_youth","parent_name":"Children and Youth"},{"name":"Rate of Foster Care Admissions","data_endpoint":"rate-of-foster-care-admissions","has_map":0,"id":"2014","show_on_dashboard":1,"show_on_homepage":0,"subtopic":null,"parent_url":"children_youth","parent_name":"Children and Youth"},{"name":"Teen Pregnancy","data_endpoint":"teen-pregnancy","has_map":0,"id":"2019","show_on_dashboard":1,"show_on_homepage":0,"subtopic":null,"parent_url":"children_youth","parent_name":"Children and Youth"},{"name":"Children Living in Poverty, by Race\/Ethnicity","data_endpoint":"children-living-in-poverty-by-race-ethnicity","has_map":0,"id":"2011","show_on_dashboard":1,"show_on_homepage":0,"subtopic":null,"topic":"Children and Youth","racial_equity":1,"parent_url":"racial-equity","parent_name":"Racial Equity"},{"name":"Single-Parent Families, by Race\/Ethnicity","data_endpoint":"single-parent-families-by-race-ethnicity","has_map":0,"id":"2021","show_on_dashboard":1,"show_on_homepage":0,"subtopic":null,"topic":"Children and Youth","racial_equity":1,"parent_url":"racial-equity","parent_name":"Racial Equity"},{"name":"Population by Race\/Ethnicity","data_endpoint":"population-by-race-ethnicity","has_map":0,"id":"4003","show_on_dashboard":1,"show_on_homepage":0,"subtopic":null,"topic":"Demographics","racial_equity":1,"parent_url":"racial-equity","parent_name":"Racial Equity"},{"name":"Student Performance on Grade 4 English, by Race\/Ethnicity","data_endpoint":"student-performance-on-grade-4-english-by-race-ethnicity","has_map":0,"id":"6016","show_on_dashboard":1,"show_on_homepage":0,"subtopic":null,"topic":"Education","racial_equity":1,"parent_url":"racial-equity","parent_name":"Racial Equity"},{"name":"Student Performance on Grade 4 Math, by Race\/Ethnicity","data_endpoint":"student-performance-on-grade-4-math-by-race-ethnicity","has_map":0,"id":"6019","show_on_dashboard":1,"show_on_homepage":0,"subtopic":null,"topic":"Education","racial_equity":1,"parent_url":"racial-equity","parent_name":"Racial Equity"},{"name":"Education Levels of Adults, by Race\/Ethnicity","data_endpoint":"education-levels-of-adults-by-race-ethnicity","has_map":0,"id":"6057","show_on_dashboard":1,"show_on_homepage":0,"subtopic":null,"topic":"Education","racial_equity":1,"parent_url":"racial-equity","parent_name":"Racial Equity"},{"name":"Median Household Income, by Race\/Ethnicity","data_endpoint":"median-household-income-by-race-ethnicity","has_map":0,"id":"8002","show_on_dashboard":1,"show_on_homepage":0,"subtopic":null,"topic":"Financial Stability","racial_equity":1,"parent_url":"racial-equity","parent_name":"Racial Equity"},{"name":"People Living in Poverty, by Race\/Ethnicity","data_endpoint":"people-living-in-poverty-by-race-ethnicity","has_map":0,"id":"8005","show_on_dashboard":1,"show_on_homepage":0,"subtopic":null,"topic":"Financial Stability","racial_equity":1,"parent_url":"racial-equity","parent_name":"Racial Equity"},{"name":"Early Prenatal Care, by Mother's Race\/Ethnicity","data_endpoint":"early-prenatal-care-by-mothers-race-ethnicity","has_map":0,"id":"2002","show_on_dashboard":1,"show_on_homepage":0,"subtopic":null,"topic":"Health","racial_equity":1,"parent_url":"racial-equity","parent_name":"Racial Equity"},{"name":"Homeownership Rates, by Race\/Ethnicity","data_endpoint":"homeownership-rates-by-race-ethnicity","has_map":0,"id":"10003","show_on_dashboard":1,"show_on_homepage":0,"subtopic":null,"topic":"Housing","racial_equity":1,"parent_url":"racial-equity","parent_name":"Racial Equity"},{"name":"Cost of Rent, by Race\/Ethnicity","data_endpoint":"cost-of-rent-by-race-ethnicity","has_map":0,"id":"10013","show_on_dashboard":1,"show_on_homepage":0,"subtopic":null,"topic":"Housing","racial_equity":1,"parent_url":"racial-equity","parent_name":"Racial Equity"},{"name":"Arrest Rates, by Race\/Ethnicity","data_endpoint":"arrest-rates-by-race-ethnicity","has_map":0,"id":"11023","show_on_dashboard":1,"show_on_homepage":0,"subtopic":null,"topic":"Community","racial_equity":1,"parent_url":"racial-equity","parent_name":"Racial Equity"},{"name":"Incarceration Rates, by Race\/Ethnicity","data_endpoint":"incarceration-rates-by-race-ethnicity","has_map":0,"id":"11018","show_on_dashboard":1,"show_on_homepage":0,"subtopic":null,"topic":"Community","racial_equity":1,"parent_url":"racial-equity","parent_name":"Racial Equity"},{"name":"Voter Registration Rate","data_endpoint":"voter-registration-rate","has_map":0,"id":"3004","show_on_dashboard":1,"show_on_homepage":0,"subtopic":null,"parent_url":"community","parent_name":"Community"},{"name":"Voter Participation Rate","data_endpoint":"voter-participation-rate","has_map":0,"id":"3005","show_on_dashboard":1,"show_on_homepage":1,"subtopic":null,"parent_url":"community","parent_name":"Community"},{"name":"Violent Crimes","data_endpoint":"violent-crimes","has_map":0,"id":"11002","show_on_dashboard":1,"show_on_homepage":0,"subtopic":null,"parent_url":"community","parent_name":"Community"},{"name":"Domestic Violence","data_endpoint":"domestic-violence","has_map":0,"id":"11009","show_on_dashboard":1,"show_on_homepage":0,"subtopic":null,"parent_url":"community","parent_name":"Community"},{"name":"Arrest Rates, by Race\/Ethnicity","data_endpoint":"arrest-rates-by-race-ethnicity","has_map":0,"id":"11023","show_on_dashboard":1,"show_on_homepage":0,"subtopic":null,"parent_url":"community","parent_name":"Community"},{"name":"Incarceration Rates, by Race\/Ethnicity","data_endpoint":"incarceration-rates-by-race-ethnicity","has_map":0,"id":"11018","show_on_dashboard":1,"show_on_homepage":0,"subtopic":null,"parent_url":"community","parent_name":"Community"},{"name":"Total Population","data_endpoint":"total-population","has_map":0,"id":"4001","show_on_dashboard":1,"show_on_homepage":1,"subtopic":null,"parent_url":"demographics","parent_name":"Demographics"},{"name":"Population by Age","data_endpoint":"population-by-age","has_map":0,"id":"4002","show_on_dashboard":0,"show_on_homepage":0,"subtopic":null,"parent_url":"demographics","parent_name":"Demographics"},{"name":"Population by Race\/Ethnicity","data_endpoint":"population-by-race-ethnicity","has_map":0,"id":"4003","show_on_dashboard":1,"show_on_homepage":0,"subtopic":null,"parent_url":"demographics","parent_name":"Demographics"},{"name":"Household Types","data_endpoint":"household-types","has_map":0,"id":"4006","show_on_dashboard":0,"show_on_homepage":0,"subtopic":null,"parent_url":"demographics","parent_name":"Demographics"},{"name":"Foreign-Born Population","data_endpoint":"foreign-born-population","has_map":1,"id":"4009","show_on_dashboard":1,"show_on_homepage":0,"subtopic":null,"parent_url":"demographics","parent_name":"Demographics"},{"name":"Change in Total Jobs","data_endpoint":"change-in-total-jobs","has_map":0,"id":"5001","show_on_dashboard":1,"show_on_homepage":0,"subtopic":null,"parent_url":"economy","parent_name":"Economy"},{"name":"Change in Jobs by Sector","data_endpoint":"change-in-jobs-by-sector","has_map":0,"id":"5003","show_on_dashboard":0,"show_on_homepage":0,"subtopic":null,"parent_url":"economy","parent_name":"Economy"},{"name":"Spending for County Government","data_endpoint":"spending-for-county-government","has_map":0,"id":"5021","show_on_dashboard":1,"show_on_homepage":0,"subtopic":null,"parent_url":"economy","parent_name":"Economy"},{"name":"Tourism Revenue","data_endpoint":"tourism-revenue","has_map":0,"id":"1004","show_on_dashboard":1,"show_on_homepage":0,"subtopic":null,"parent_url":"economy","parent_name":"Economy"},{"name":"Preschoolers Receiving Special Education Services","data_endpoint":"preschoolers-receiving-special-education-services","has_map":0,"id":"6003","show_on_dashboard":1,"show_on_homepage":0,"subtopic":null,"parent_url":"education","parent_name":"Education"},{"name":"Prekindergarten Participation","data_endpoint":"prekindergarten-participation","has_map":0,"id":"6001","show_on_dashboard":1,"show_on_homepage":0,"subtopic":null,"parent_url":"education","parent_name":"Education"},{"name":"Students Receiving Special Education Services","data_endpoint":"students-receiving-special-education-services","has_map":0,"id":"6051","show_on_dashboard":1,"show_on_homepage":0,"subtopic":null,"parent_url":"education","parent_name":"Education"},{"name":"Per-Student Spending","data_endpoint":"per-student-spending","has_map":0,"id":"6004","show_on_dashboard":1,"show_on_homepage":0,"subtopic":null,"parent_url":"education","parent_name":"Education"},{"name":"Student Performance on Grade 4 English, by Student Group","data_endpoint":"student-performance-on-grade-4-english-by-student-group","has_map":0,"id":"6015","show_on_dashboard":1,"show_on_homepage":0,"subtopic":null,"parent_url":"education","parent_name":"Education"},{"name":"Student Performance on Grade 4 English, by Race\/Ethnicity","data_endpoint":"student-performance-on-grade-4-english-by-race-ethnicity","has_map":0,"id":"6016","show_on_dashboard":1,"show_on_homepage":0,"subtopic":null,"parent_url":"education","parent_name":"Education"},{"name":"Student Performance on Grade 4 Math, by Student Group","data_endpoint":"student-performance-on-grade-4-math-by-student-group","has_map":0,"id":"6018","show_on_dashboard":1,"show_on_homepage":0,"subtopic":null,"parent_url":"education","parent_name":"Education"},{"name":"Student Performance on Grade 4 Math, by Race\/Ethnicity","data_endpoint":"student-performance-on-grade-4-math-by-race-ethnicity","has_map":0,"id":"6019","show_on_dashboard":1,"show_on_homepage":0,"subtopic":null,"parent_url":"education","parent_name":"Education"},{"name":"High School Cohort Graduation Rate","data_endpoint":"high-school-cohort-graduation-rate","has_map":0,"id":"6035","show_on_dashboard":1,"show_on_homepage":1,"subtopic":null,"parent_url":"education","parent_name":"Education"},{"name":"High School Cohort Dropout Rate","data_endpoint":"high-school-cohort-dropout-rate","has_map":0,"id":"6039","show_on_dashboard":1,"show_on_homepage":0,"subtopic":null,"parent_url":"education","parent_name":"Education"},{"name":"High School GED Rate","data_endpoint":"high-school-ged-rate","has_map":0,"id":"6041","show_on_dashboard":1,"show_on_homepage":0,"subtopic":null,"parent_url":"education","parent_name":"Education"},{"name":"Education Levels of Adults","data_endpoint":"education-levels-of-adults","has_map":1,"id":"6056","show_on_dashboard":0,"show_on_homepage":0,"subtopic":null,"parent_url":"education","parent_name":"Education"},{"name":"Education Levels of Adults, by Race\/Ethnicity","data_endpoint":"education-levels-of-adults-by-race-ethnicity","has_map":0,"id":"6057","show_on_dashboard":1,"show_on_homepage":0,"subtopic":null,"parent_url":"education","parent_name":"Education"},{"name":"Median Household Income","data_endpoint":"median-household-income","has_map":1,"id":"8001","show_on_dashboard":1,"show_on_homepage":0,"subtopic":null,"parent_url":"financial_stability","parent_name":"Financial Stability"},{"name":"Median Household Income, by Race\/Ethnicity","data_endpoint":"median-household-income-by-race-ethnicity","has_map":0,"id":"8002","show_on_dashboard":1,"show_on_homepage":0,"subtopic":null,"parent_url":"financial_stability","parent_name":"Financial Stability"},{"name":"People Living in Poverty","data_endpoint":"people-living-in-poverty","has_map":1,"id":"8004","show_on_dashboard":1,"show_on_homepage":0,"subtopic":null,"parent_url":"financial_stability","parent_name":"Financial Stability"},{"name":"People Living in Poverty, by Race\/Ethnicity","data_endpoint":"people-living-in-poverty-by-race-ethnicity","has_map":0,"id":"8005","show_on_dashboard":1,"show_on_homepage":0,"subtopic":null,"parent_url":"financial_stability","parent_name":"Financial Stability"},{"name":"Seniors Living in Poverty","data_endpoint":"seniors-living-in-poverty","has_map":1,"id":"8007","show_on_dashboard":1,"show_on_homepage":0,"subtopic":null,"parent_url":"financial_stability","parent_name":"Financial Stability"},{"name":"Veterans Living in Poverty","data_endpoint":"veterans-living-in-poverty","has_map":1,"id":"8008","show_on_dashboard":1,"show_on_homepage":0,"subtopic":null,"parent_url":"financial_stability","parent_name":"Financial Stability"},{"name":"Children Receiving Subsidized Child Care","data_endpoint":"children-receiving-subsidized-child-care","has_map":0,"id":"2008","show_on_dashboard":1,"show_on_homepage":0,"subtopic":null,"parent_url":"financial_stability","parent_name":"Financial Stability"},{"name":"Economically Disadvantaged Students","data_endpoint":"economically-disadvantaged-students","has_map":0,"id":"6053","show_on_dashboard":1,"show_on_homepage":0,"subtopic":null,"parent_url":"financial_stability","parent_name":"Financial Stability"},{"name":"Earned Income Tax Credit Participation","data_endpoint":"earned-income-tax-credit-participation","has_map":0,"id":"8019","show_on_dashboard":1,"show_on_homepage":0,"subtopic":null,"parent_url":"financial_stability","parent_name":"Financial Stability"},{"name":"Living Wage Rate by Household Type","data_endpoint":"living-wage-rate-by-household-type","has_map":0,"id":"8021","show_on_dashboard":0,"show_on_homepage":0,"subtopic":null,"parent_url":"financial_stability","parent_name":"Financial Stability"},{"name":"Income in Relation to Poverty Level","data_endpoint":"income-in-relation-to-poverty-level","has_map":0,"id":"8010","show_on_dashboard":0,"show_on_homepage":0,"subtopic":null,"parent_url":"financial_stability","parent_name":"Financial Stability"},{"name":"Households Receiving SNAP","data_endpoint":"households-receiving-snap","has_map":0,"id":"8038","show_on_dashboard":1,"show_on_homepage":0,"subtopic":null,"parent_url":"financial_stability","parent_name":"Financial Stability"},{"name":"Food Insecurity","data_endpoint":"food-insecurity","has_map":0,"id":"8023","show_on_dashboard":1,"show_on_homepage":0,"subtopic":null,"parent_url":"financial_stability","parent_name":"Financial Stability"},{"name":"People Without Health Insurance","data_endpoint":"people-without-health-insurance","has_map":0,"id":"9001","show_on_dashboard":1,"show_on_homepage":0,"subtopic":null,"parent_url":"health","parent_name":"Health"},{"name":"Early Prenatal Care, by Mother's Race\/Ethnicity","data_endpoint":"early-prenatal-care-by-mothers-race-ethnicity","has_map":0,"id":"2002","show_on_dashboard":1,"show_on_homepage":0,"subtopic":null,"parent_url":"health","parent_name":"Health"},{"name":"Deaths from Drug Overdoses","data_endpoint":"deaths-from-drug-overdoses","has_map":0,"id":"9012","show_on_dashboard":1,"show_on_homepage":0,"subtopic":null,"parent_url":"health","parent_name":"Health"},{"name":"Babies with Low Birth Weights","data_endpoint":"babies-with-low-birth-weights","has_map":0,"id":"2003","show_on_dashboard":1,"show_on_homepage":0,"subtopic":null,"parent_url":"health","parent_name":"Health"},{"name":"Newly Diagnosed Cases of HIV","data_endpoint":"newly-diagnosed-cases-of-hiv","has_map":0,"id":"9084","show_on_dashboard":1,"show_on_homepage":0,"subtopic":null,"parent_url":"health","parent_name":"Health"},{"name":"People Living wth HIV","data_endpoint":"people-living-wth-hiv","has_map":0,"id":"9019","show_on_dashboard":1,"show_on_homepage":0,"subtopic":null,"parent_url":"health","parent_name":"Health"},{"name":"Mental Health Clinic Visits","data_endpoint":"mental-health-clinic-visits","has_map":0,"id":"9032","show_on_dashboard":1,"show_on_homepage":0,"subtopic":null,"parent_url":"health","parent_name":"Health"},{"name":"Homeownership Rates","data_endpoint":"homeownership-rates","has_map":1,"id":"10002","show_on_dashboard":1,"show_on_homepage":0,"subtopic":null,"parent_url":"housing","parent_name":"Housing"},{"name":"Homeownership Rates, by Race\/Ethnicity","data_endpoint":"homeownership-rates-by-race-ethnicity","has_map":0,"id":"10003","show_on_dashboard":1,"show_on_homepage":0,"subtopic":null,"parent_url":"housing","parent_name":"Housing"},{"name":"Cost of Homeownership","data_endpoint":"cost-of-homeownership","has_map":1,"id":"10006","show_on_dashboard":1,"show_on_homepage":0,"subtopic":null,"parent_url":"housing","parent_name":"Housing"},{"name":"Cost of Rent","data_endpoint":"cost-of-rent","has_map":1,"id":"10012","show_on_dashboard":1,"show_on_homepage":0,"subtopic":null,"parent_url":"housing","parent_name":"Housing"},{"name":"Cost of Rent, by Race\/Ethnicity","data_endpoint":"cost-of-rent-by-race-ethnicity","has_map":0,"id":"10013","show_on_dashboard":1,"show_on_homepage":0,"subtopic":null,"parent_url":"housing","parent_name":"Housing"},{"name":"Homeless Persons","data_endpoint":"homeless-persons","has_map":0,"id":"10017","show_on_dashboard":1,"show_on_homepage":0,"subtopic":null,"parent_url":"housing","parent_name":"Housing"}]
["children_youth","racial-equity","community","demographics","economy","education","financial_stability","health","housing"]
["Children and Youth","Racial Equity","Community","Demographics","Economy","Education","Financial Stability","Health","Housing"]
Indicator Dashboard
Create your own Dashboard of key indicators
Use the filter to select as many indicators as you like to create a customized Dashboard.
Note that asterisks reflect uncertainty in the estimates – see full indicator for a fuller explanation.
Select a Geography
Region
Columbia
Dutchess
Greene
Orange
Putnam
Sullivan
Ulster
Beacon city, Dutchess County
Poughkeepsie city, Dutchess County
Hyde Park town, Dutchess County
North East town, Dutchess County
Catskill town, Greene County
Middletown city, Orange County
Newburgh city, Orange County
Port Jervis city, Orange County
Carmel town, Putnam County
Kingston city, Ulster County
Filter
More powerful connections
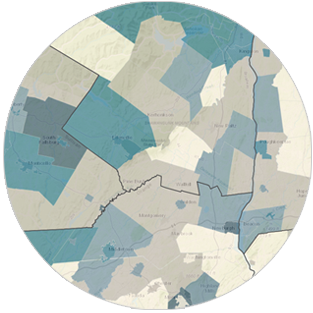
Map Data
Interactive map visualizations provide unique analytical power, showing variations within communities.
VIEW COMPLETE MAP DATA
Children Living in Poverty
Children Living in Poverty, by Race/Ethnicity
Single-Parent Families
Single-Parent Families, by Race/Ethnicity
Rate of Child Abuse and Neglect
Rate of Foster Care Admissions
Teen Pregnancy
Children Living in Poverty, by Race/Ethnicity
Single-Parent Families, by Race/Ethnicity
Population by Race/Ethnicity
Student Performance on Grade 4 English, by Race/Ethnicity
Student Performance on Grade 4 Math, by Race/Ethnicity
Education Levels of Adults, by Race/Ethnicity
Median Household Income, by Race/Ethnicity
People Living in Poverty, by Race/Ethnicity
Early Prenatal Care, by Mother's Race/Ethnicity
Homeownership Rates, by Race/Ethnicity
Cost of Rent, by Race/Ethnicity
Arrest Rates, by Race/Ethnicity
Incarceration Rates, by Race/Ethnicity
Voter Registration Rate
Voter Participation Rate
Violent Crimes
Domestic Violence
Arrest Rates, by Race/Ethnicity
Incarceration Rates, by Race/Ethnicity
Total Population
Population by Age
Population by Race/Ethnicity
Household Types
Foreign-Born Population
Change in Total Jobs
Change in Jobs by Sector
Spending for County Government
Tourism Revenue
Preschoolers Receiving Special Education Services
Prekindergarten Participation
Students Receiving Special Education Services
Per-Student Spending
Student Performance on Grade 4 English, by Student Group
Student Performance on Grade 4 English, by Race/Ethnicity
Student Performance on Grade 4 Math, by Student Group
Student Performance on Grade 4 Math, by Race/Ethnicity
High School Cohort Graduation Rate
High School Cohort Dropout Rate
High School GED Rate
Education Levels of Adults
Education Levels of Adults, by Race/Ethnicity
Median Household Income
Median Household Income, by Race/Ethnicity
People Living in Poverty
People Living in Poverty, by Race/Ethnicity
Seniors Living in Poverty
Veterans Living in Poverty
Children Receiving Subsidized Child Care
Economically Disadvantaged Students
Earned Income Tax Credit Participation
Living Wage Rate by Household Type
Income in Relation to Poverty Level
Households Receiving SNAP
Food Insecurity
People Without Health Insurance
Early Prenatal Care, by Mother's Race/Ethnicity
Deaths from Drug Overdoses
Babies with Low Birth Weights
Newly Diagnosed Cases of HIV
People Living wth HIV
Mental Health Clinic Visits
Homeownership Rates
Homeownership Rates, by Race/Ethnicity
Cost of Homeownership
Cost of Rent
Cost of Rent, by Race/Ethnicity
Homeless Persons
Loading...


 Children & Youth
 Community
 Demographics
 Economy
 Education
 Financial Stability
 Health
 Housing
 Racial Equity