Children and Youth
Children Living in Poverty
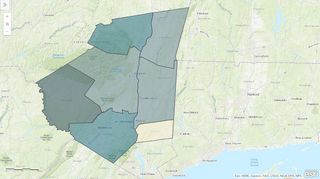
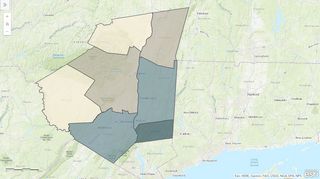
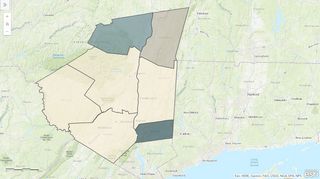
The estimated number of children under 18 living below the federally defined poverty line, expressed as a percentage of all children under 18. Poverty thresholds vary by family composition and year. In 2024, the threshold for a four-person family was $31,812.
VIEW MAP
The estimated number of children under 18 living below the federally defined poverty line, expressed as a percentage of all children under 18. Poverty thresholds vary by family composition and year. In 2024, the threshold for a four-person family was $31,812.
VIEW MAP
Single-Parent Families
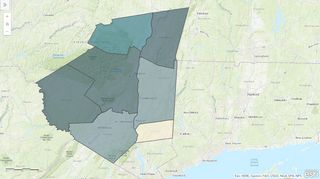
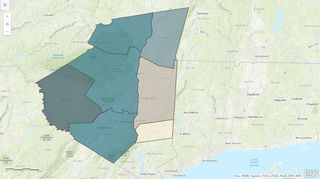
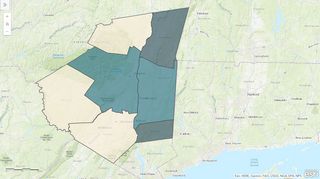
The estimated number of single-parent families with children under 18, as a percent of all families with children under 18.
VIEW MAP
The estimated number of single-parent families with children under 18, as a percent of all families with children under 18.
VIEW MAP
Demographics
Foreign-Born Population
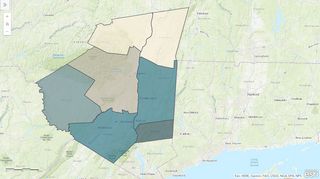
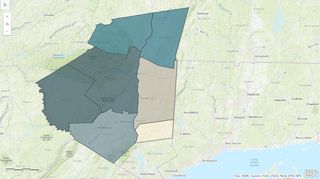
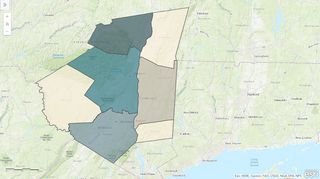
The percentage of the population in a region that is foreign-born, which includes anyone who is not a U.S. citizen at birth. People who become U.S. citizens through naturalization are considered foreign-born.
VIEW MAP
The percentage of the population in a region that is foreign-born, which includes anyone who is not a U.S. citizen at birth. People who become U.S. citizens through naturalization are considered foreign-born.
VIEW MAP
Education
Education Levels of Adults
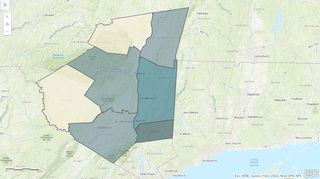
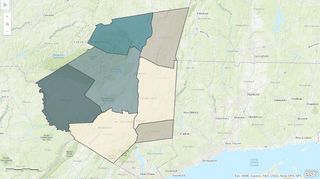
The number of residents with a particular level of education, expressed as a percentage of all residents 25 and older.
VIEW MAP
The number of residents with a particular level of education, expressed as a percentage of all residents 25 and older.
VIEW MAP
Financial Stability
Median Household Income
Median household income, inflated to 2024 dollars. Half of incomes are below the median and half are above.
VIEW MAP
Median household income, inflated to 2024 dollars. Half of incomes are below the median and half are above.
VIEW MAP
People Living in Poverty
The estimated number of people with incomes below the poverty line, as a percentage of those for whom poverty status has been determined. Poverty thresholds vary by family composition and year. In 2024, the threshold for a four-person family with two children was $31,812.
VIEW MAP
The estimated number of people with incomes below the poverty line, as a percentage of those for whom poverty status has been determined. Poverty thresholds vary by family composition and year. In 2024, the threshold for a four-person family with two children was $31,812.
VIEW MAP
Seniors Living in Poverty
The estimated proportion of residents 65 and older with incomes below the poverty line. In 2024, the threshold for a person 65 or older was $15,050.
VIEW MAP
The estimated proportion of residents 65 and older with incomes below the poverty line. In 2024, the threshold for a person 65 or older was $15,050.
VIEW MAP
Veterans Living in Poverty
The estimated proportion of veterans with incomes below the poverty line. Poverty thresholds vary by family composition and year. In 2024, the threshold for one person was $15,940.
VIEW MAP
The estimated proportion of veterans with incomes below the poverty line. Poverty thresholds vary by family composition and year. In 2024, the threshold for one person was $15,940.
VIEW MAP
Housing
Homeownership Rates
The percentage of all occupied housing units (not vacant) that are owner-occupied (not rented).
VIEW MAP
The percentage of all occupied housing units (not vacant) that are owner-occupied (not rented).
VIEW MAP
Cost of Homeownership
The ratio of the median home value divided by the median household income, adjusted for inflation.
VIEW MAP
The ratio of the median home value divided by the median household income, adjusted for inflation.
VIEW MAP
Cost of Rent
The proportion of household income that goes toward monthly rent, utilities, and fuel, calculated by dividing median rent by median household income for renters.
VIEW MAP
The proportion of household income that goes toward monthly rent, utilities, and fuel, calculated by dividing median rent by median household income for renters.
VIEW MAP
 Children & Youth
 Community
 Demographics
 Economy
 Education
 Financial Stability
 Health
 Housing
 Racial Equity


