A Community
Indicators Project
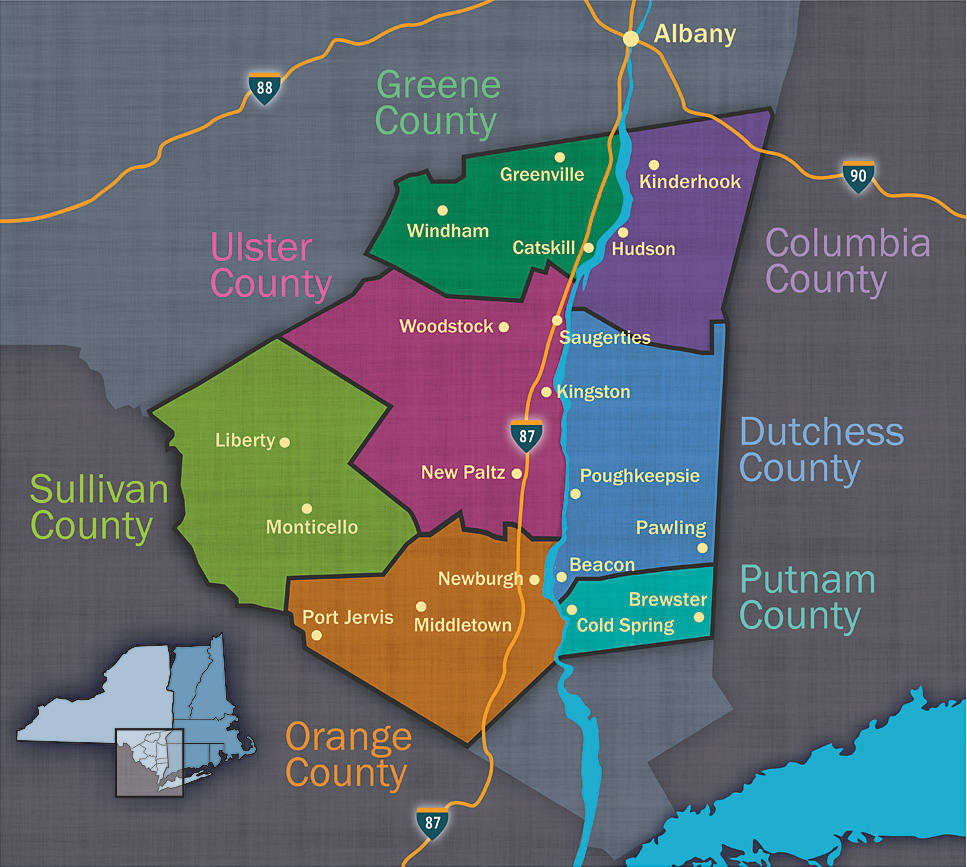
for Columbia, Dutchess, Greene, Orange,
Putnam , Sullivan and Ulster Counties


Demographics
Change in Total Population by Race/Ethnicity, Since 2000


 Children & Youth
 Community
 Demographics
 Economy
 Education
 Financial Stability
 Health
 Housing
 Racial Equity


